iCrowd Newswire
12 Jan 2022, 21:32 GMT+10
Due to the variety of technical indicators, novice traders often cannot choose a suitable instrument for their trade. Haste, lack of experience and inept use are the reasons for angry reviews written about this or that indicator. However, among these technical assistants, there are true classics, whose good reputation is based on many years of testing.
Bollinger Bands® is a technical analysis tool created in the already distant 80s. Its popularity, reaching its peak, did not fall at all, as the developer relied on practicality and ease of use.
Bollinger Bands use the principle of moving averages, but there are three of them, which significantly expand the general functionality of this indicator. So, it allows you to track not only the price changes, but also the general nature of the market situation as well.
By using Bollinger Bands, you can conduct a statistical analysis of the price indicators, which allows you to track short-term movements that occur at a sufficient distance from the main trend line. In turn, this gives traders the ability to assess the current volatility of the market. At the same time, you can apply the Bollinger Band breakout strategy which utilizes the volatility range and prior swing highs and lows to determine trading opportunities.
The Bollinger indicator includes 3 lines. The trend axis is determined by the moving average SMA, on either side of it, there are auxiliary lines that form a kind of corridor. They also belong to the category of moving averages, but they work exclusively with price extremes.
We can say that the market prices of the assets under consideration are almost always within the mentioned corridor. The distance between the moving averages depends on the scale of price deviations, therefore, with low market volatility, the corridor narrows, and with high volatility, it expands. Traders assume in the first case a flat, in the second - a pronounced trend. Its direction corresponds to the direction of the middle line.
Bollinger Band investors use concepts such as oversold and overbought. In the first case, the asset value falls to the lower moving average. This means that the price has dropped to the lowest possible levels. With a high probability (but not always), it will leave the oversold zone and return to the middle line. But until this happens, traders can buy the asset at the lowest possible prices.
Overbought is characterized by the same situation, but it occurs already near the upper borders of the corridor. In this case, currency speculators open sell deals. The whole catch here lies in the accuracy of determining the moments of price reversals. There are other signals that allow traders to make decisions about opening certain deals.
The situation with a "double bottom" develops according to a similar scenario, only it indicates the feasibility of buying and occurs in the lower part of the corridor: the asset value touches/breaks through the lower moving average, then returns to the trend axis, performing a reversal there.
As for the Bollinger Bands efficiency, it is largely determined by the indicator settings. However, this statement also applies to other technical analysis tools. For Bollinger Bands, a trader can edit 2 parameters: standard deviation and number of periods.
The first value determines the degree of variance in the price of the analyzed asset. Changing its size to a larger side will lead to an increase in the distance between the extreme lines and the center. Accordingly, the wider the corridor, the more price movements it covers.
Thus, the indicator borders will capture 68% of price movements in case of deviation, the value of which is 1. If this parameter is increased to 2, then the bands will "cover" already 95% of price movements. By the way, the default value is exactly 2, since it gives more accurate signals.
Periods are the time frames used by Bollinger Bands when dealing with price movements. The default is 20. With fewer bins, the Bollinger Bands will deliver more signals as the instrument's ability to track changes will increase.
Its boundaries will become less even, as a result of which there will be more frequent breakouts of the sideways moving averages on the chart. However, the number of invalid signals will also increase. The channel boundaries will become smoother, and accordingly, the number of their price breakouts will decrease. The reduction in trading opportunities is offset by the relevance of the signals received.
It is worth noting that both the analysis of charts based on the use of Bollinger Bands and the decisions made on the basis of this analysis depends on the particular speculator. There is no single universal methodology here. Volatility and the magnitude of price movements are quantities to work with.
Bollinger bands themselves occupy the leading places among the secondary indicators, but they are rarely used in the main roles. This technical analysis tool was developed for the stock market, and although it found its application on the Forex exchange, the signals received from it should be confirmed with more specialized indicators.
Get a daily dose of International Technology news through our daily email, its complimentary and keeps you fully up to date with world and business news as well.
Publish news of your business, community or sports group, personnel appointments, major event and more by submitting a news release to International Technology.
More InformationSAN FRANCISCO, California: Under pressure from European regulators, Apple has revamped its App Store policies in the EU, introducing...
New Delhi [India], July 2 (ANI): A seminar on the prospects and possibilities of artificial intelligence in Northeast India was organised...
Hyderabad (Telangana) [India], July 1 (ANI): NMDC, India's largest iron ore producer, marked a significant milestone with the inauguration...
YINCHUAN, July 1 (Xinhua) -- China on Monday reached a major milestone in desertification control by completing a barrier belt along...
Hyderabad (Telangana) [India], June 29 (ANI): Olympic Games Tokyo 2020 medalist Lovlina Borgohain eased past Punjab's Krisha Verma...
Hyderabad (Telangana) [India], June 29 (ANI): Former youth world champion Ankushita Boro showcased her class on Day 2 of the Elite...
WASHINGTON, D.C.: On Friday, President Donald Trump announced that he was halting trade discussions with Canada due to its decision...
FRANKFURT, Germany: Germany has become the latest country to challenge Chinese AI firm DeepSeek over its data practices, as pressure...
Kievs accession to the bloc would drag both Brussels and Budapest into conflict with Moscow, the Hungarian prime minister has said...
A crew from the UK has reportedly been unable to repair the aircraft for over 19 days A British F-35B Lightning II stealth fighter...
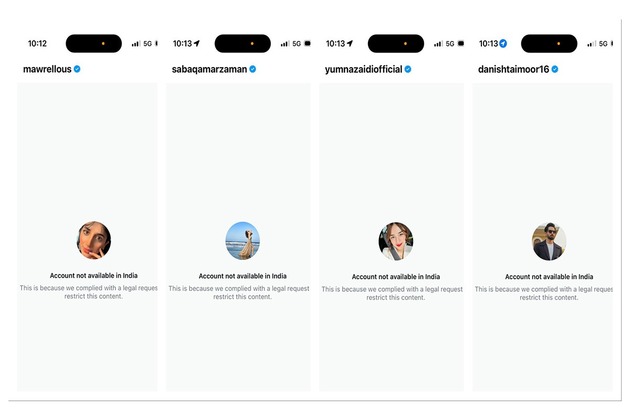
New Delhi [India], July 3 (ANI): The social media accounts of several Pakistani actors and cricketers remain blocked after it was reported...
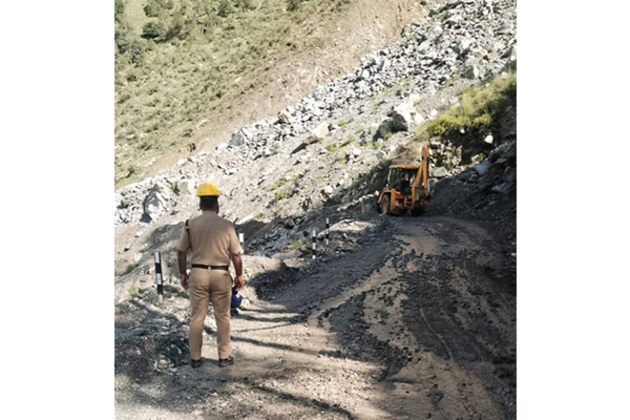
Uttarkashi (Uttarakhand) [India], July 3 (ANI): Border Road Organisation (BRO) on Thursday worked to clear the land subsidence near...